
Statistical Process Control
Monitor your process in real time and catch drift early.
SPC monitors your process with 7 control-chart types so you can separate natural variation from special causes and catch problems early.
What you gain with QUALIX
- 7 control charts automatically; limits and Western Electric rule violations are flagged instantly.
- Real-time monitoring and alarms — you're warned the moment drift appears.
- Instant Cp/Cpk as data is entered; historical trend is retained.
- No more updating spreadsheet charts or juggling scattered files.
How it works
Bring your process under statistical control — from data entry to control charts and process capability.
-
1
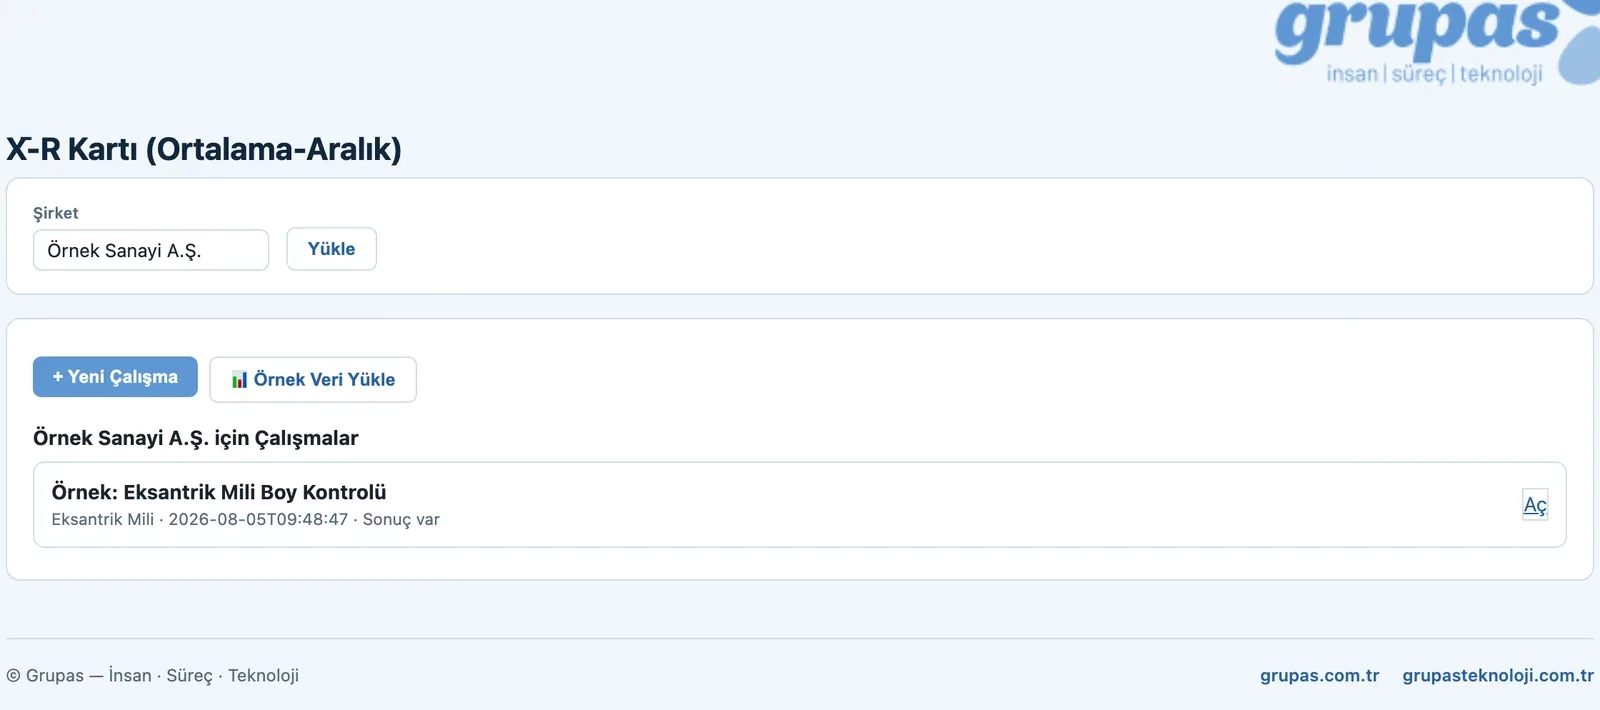
Create a chart
Enter your company and choose the chart type; start from scratch or try ready sample data.
-
2
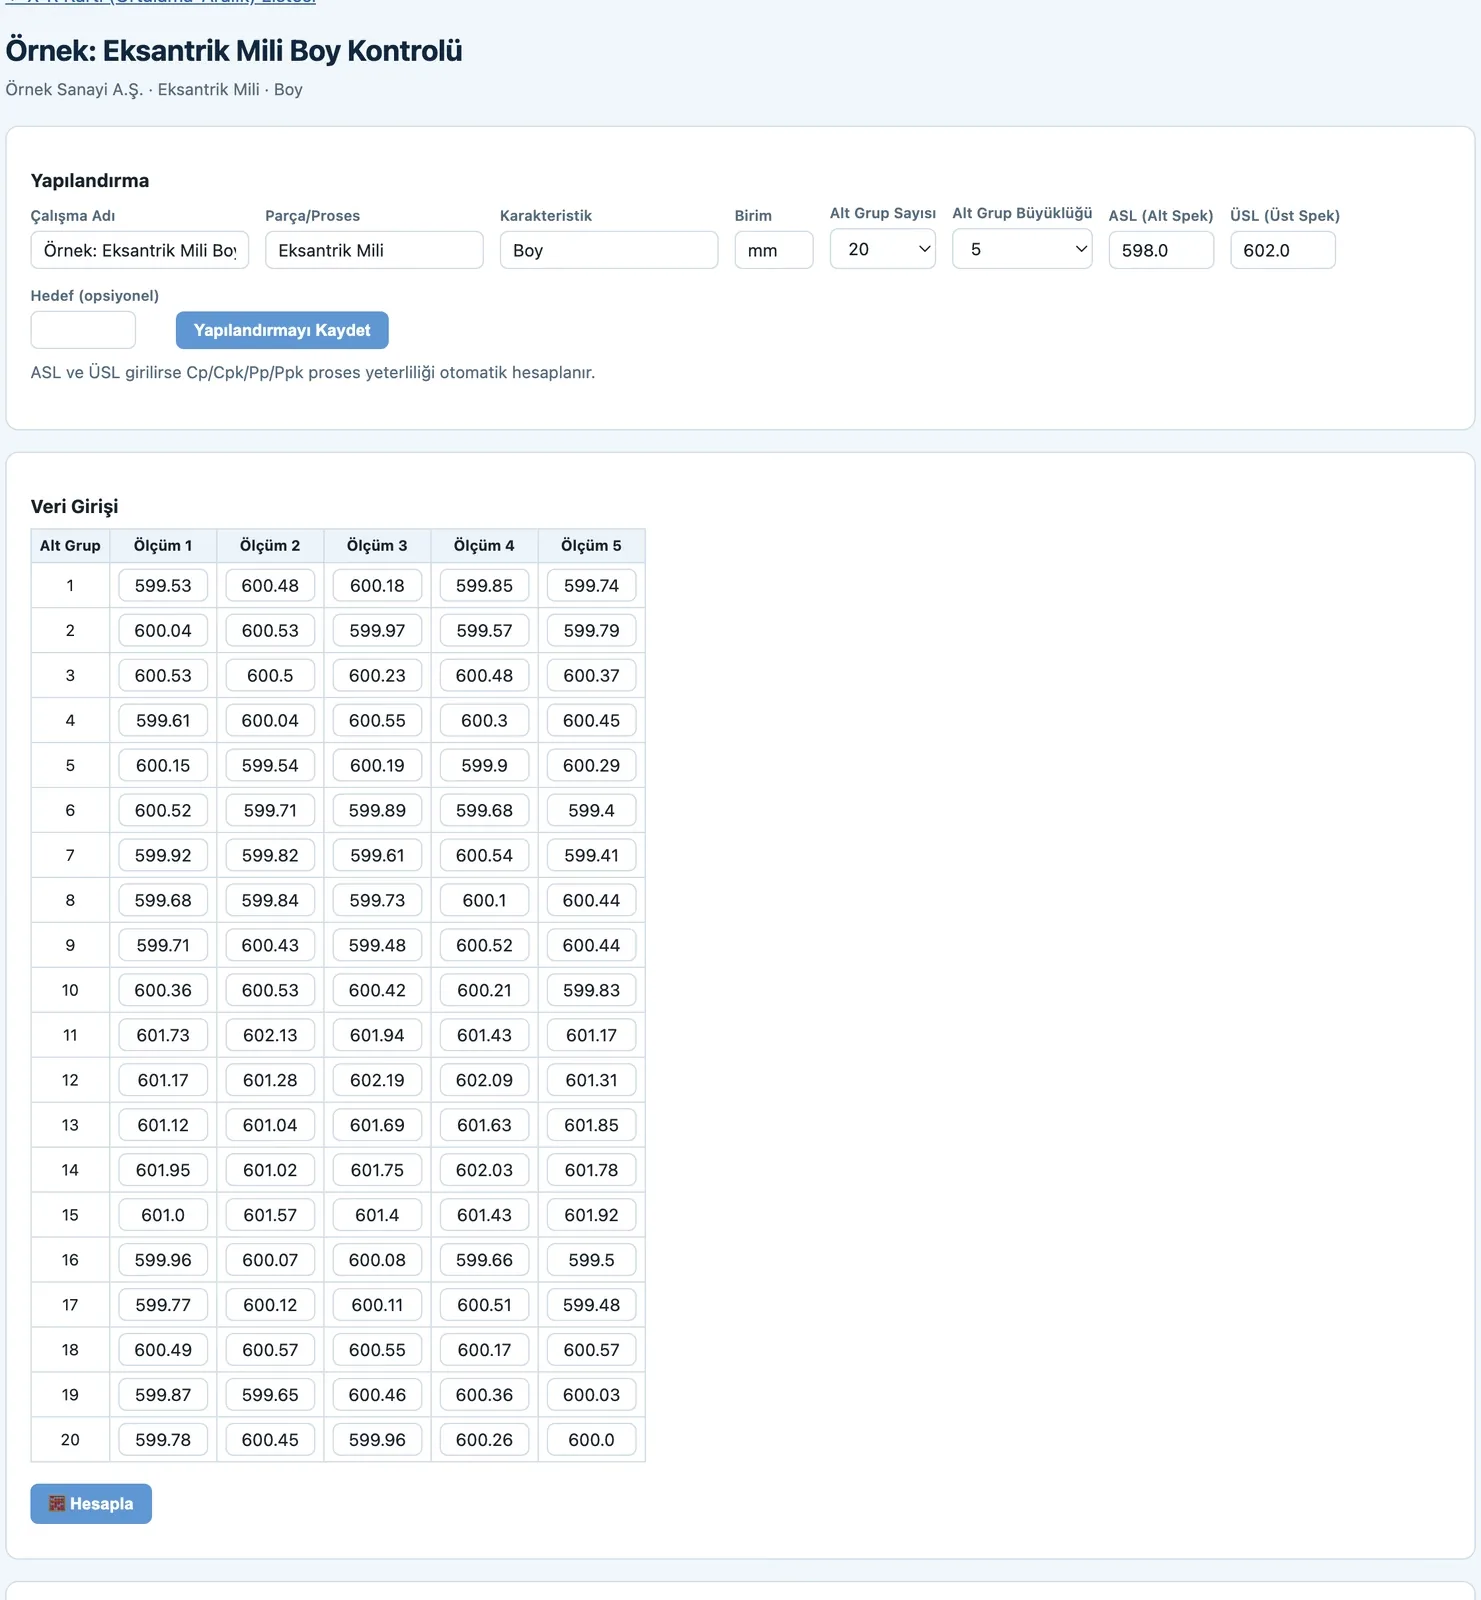
Enter the data
Set subgroup count and size and enter the readings; add lower/upper spec limits and process capability is computed automatically too.
-
3
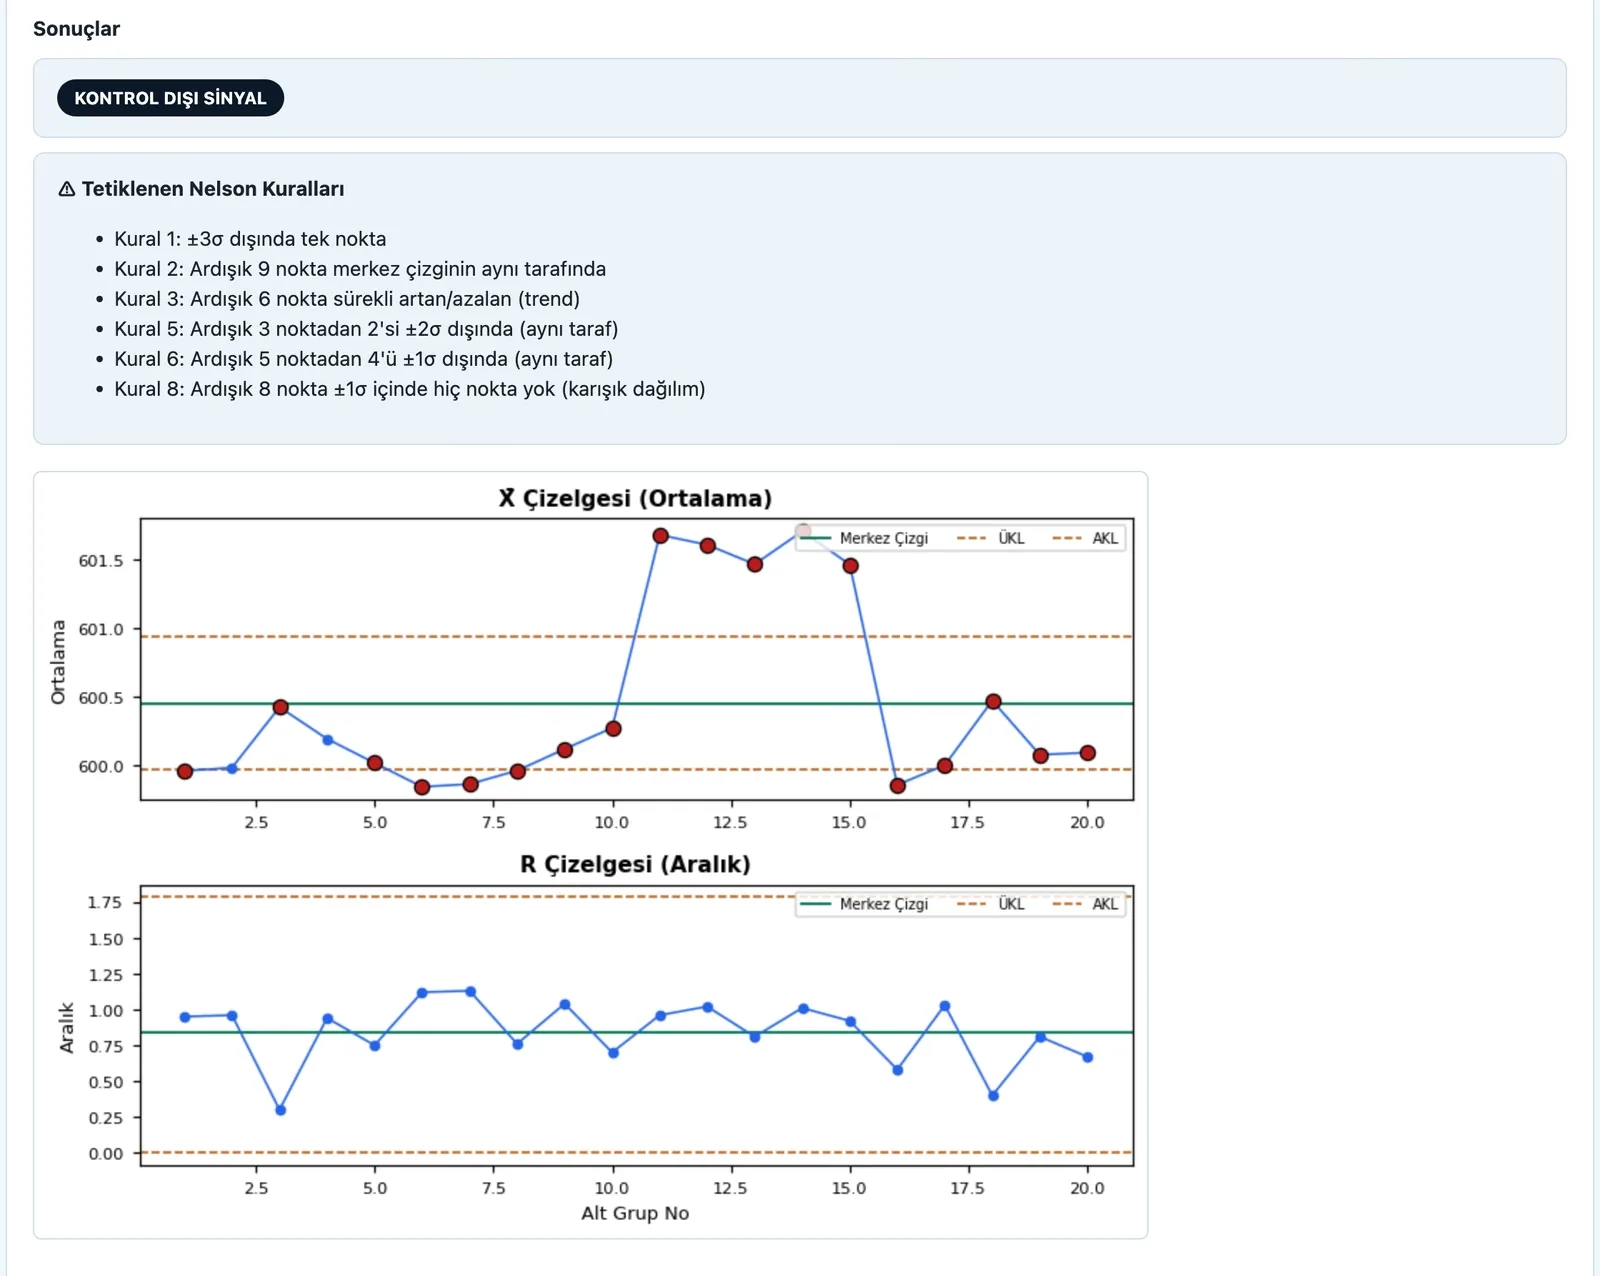
See the control chart
The centre line and UCL/LCL control limits are computed automatically; out-of-control signals are detected with the 8 Nelson rules and marked on the chart.
-
4
Measure process capability
Cp, Cpk, Pp and Ppk indices are computed with a histogram and normal curve; capable/not-capable is judged automatically and the result is exported as PDF/CSV.
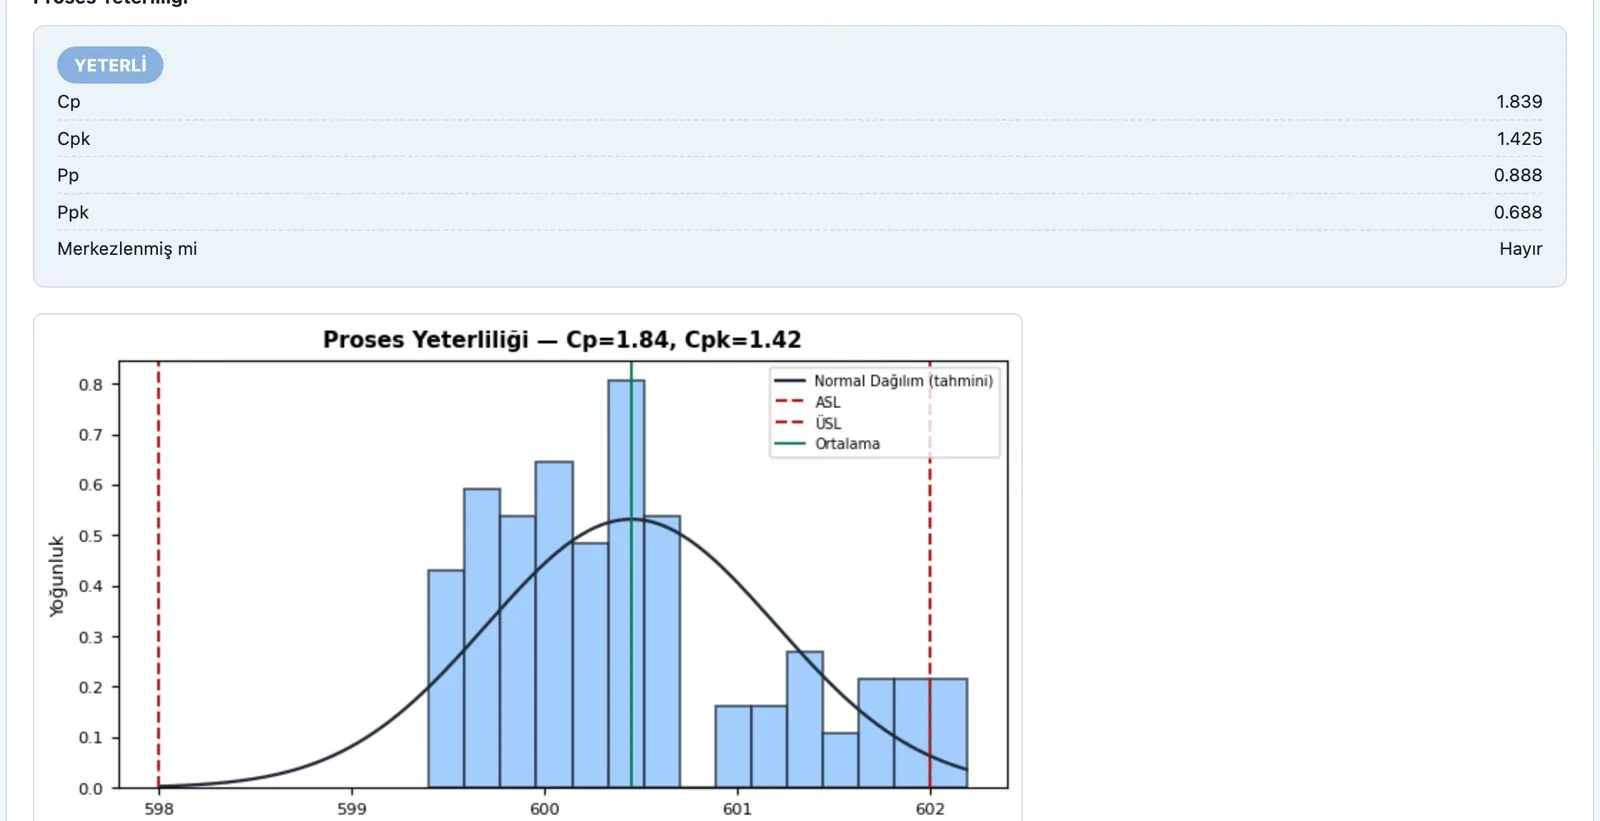
Screens are shown with sample company data.
Purpose
To keep the process in control, reduce variation and time interventions correctly — distinguishing over-adjustment from real drift.
Features
- X̄-R, X̄-s, I-MR variable charts
- p, np, c, u attribute charts
- Control limits and Western Electric rule violations
- Cp/Cpk process capability
- Trend and alarm indicators
Benefits
- Reduces scrap and rework
- Prevents downtime and loss with early warning
- Builds a data-driven decision culture
Who uses it
Production, quality and process engineering teams.
All modules
See your Core Tools work in one platform
Write to us for a live walkthrough on sample data.
Request a demo